Phasics
- Wavefront, MTF and QPI measurement solutions
- Products
- Applications
- Markets
- Company
- Contact us

March 11, 2026
Booth E7-7713 | New SID4 Sensor Launch + Live Demos + PhaseStudio Updates
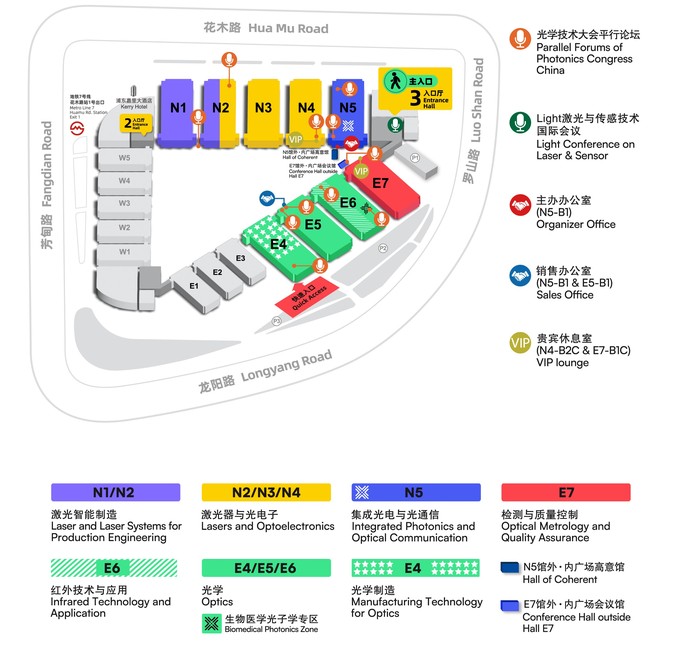
Phasics will be at LASER World of Photonics China in Shanghai from March 18 to 20, 2026.
At Booth E7-7713, we will show how our wavefront sensing technology is used for optical R&D, precision testing, and system integration. This year, we are introducing a new SID4 sensor, running three live demonstrations, and presenting major updates to our PhaseStudio software.
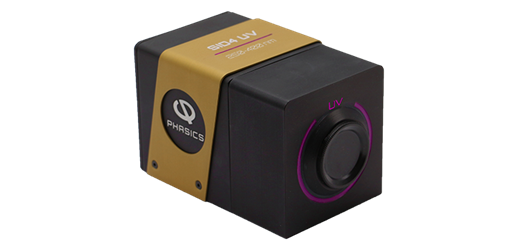
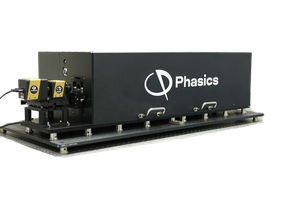
New SID4 Sensor – First Look
We are launching a new SID4 wavefront sensor at the show. This model was built specifically for applications that need:
• Large sensor apertures • High spatial sampling resolution • Wide spectral coverage
Visit our booth to see the full specifications and discuss how it fits into your specific measurement setup or integration project.

Live Demonstrations at the Booth
We will have three live demos running throughout the exhibition, each focusing on a different wavefront measurement challenge:
Demo 1. UV Wavefront Measurement
Measuring in the ultraviolet range requires high sensitivity and stability. This demo shows how to acquire and analyze wavefront data under UV conditions for optical component evaluation and beam alignment.
Demo 2. Optical Component Testing with Kaleo KIT
We will demonstrate the Kaleo KIT, a modular solution for testing optical elements. Using PhaseStudio, you can get real-time results for Wavefront Error (WFE), Zernike aberrations, PSF, and MTF in a single measurement.
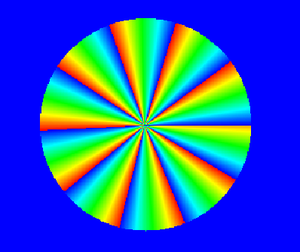
Demo 3. Vortex Wavefront Measurement
For beams with phase singularities, standard phase maps aren't enough. This demo shows how PhaseStudio identifies vortex structures directly from wavefront data, providing the exact position and topological charge of phase singularities.
PhaseStudio Software: New Analysis Tools
We have added two new analysis functions to PhaseStudio to help users get more detail from their wavefront data:
1. Vortex Analysis
Automatically detects vortex structures and outputs their index and position. It includes specialized visualization modes for rotational components, irrotational component and Laplacian, with data exportable to CSV or TXT.
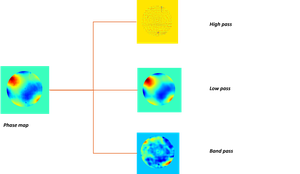
2. Spatial Frequency Analysis
This tool allows for multi-scale interpretation of phase maps. You can use high-pass, low-pass, and band-pass filtering to isolate system level trends from local high frequency errors.
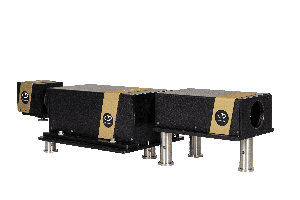
Custom Platforms & OEM Integration
Phasics also provides custom measurement platforms and OEM modules. We work with both research labs and industrial partners to build dedicated setups that fit specific mechanical or optical constraints.
If you are working on wavefront sensing, optical characterization, or vortex beam analysis, stop by Booth E7-7713 to talk with our team.
We look forward to seeing you in Shanghai.